Preventing Wealth Concentration in PoS Systems: The Role of Fork-Choice Rule and Stake Relativisation

While Proof of Stake (PoS) systems are often praised for their scalability and energy efficiency, centralisation concerns have drawn criticism about the system. Beyond centralisation, there are other issues to be concerned about, such as the possibility of wealth concentration and self-censorship. These can seriously jeopardise the fundamental principles of blockchain if not addressed properly.
The recent transition of DarkFi from the PoS-based Ouroboros Crypsinous protocol due to wealth concentration findings motivated us at Nomos to conduct our own investigation into the matter. We found that wealth concentration does not emerge from a PoS system driven by Crypsinous leader election function if certain conditions are met.
This article delves deeper into our findings about stake relativisation and the role of VRFs in the Praos leader election function.
Praos Leader Election Function: An Overview
The Praos leader election function is defined as \( ϕ_f(α) = 1 - (1 - f)^α \), where \( f ∈ [0, 1] \) is the active slot coefficient and where \( α ∈ [0, 1] \) represents a validator's relative stake.
Every validator computes its own \( ϕ_f(α) \). To become a block proposer, each validator draws a number, r, ranging from 0 to 1. The validator qualifies as a block proposer if r is lower than \( ϕ_f(α) \).
Our research opts for the interpretation of \( ϕ_f(α) \) not as a probability of a validator to become a block proposer, but as a rate at which the validator is expected to be observed as a block proposer. Here's why.
Double Interpretation of the Leader Election Function:
- Probability Interpretation: If \( ϕ_f(α) \) is 0.001 for a validator, there is a 0.1% chance that this validator will be chosen to propose a block in any given slot.
- Rate Interpretation: Alternatively, it could mean that, on average, the validator is expected to propose one block every 1000 slots.
Both interpretations seem equivalent if you consider a validator as a single entity over time. However, this changes when you consider the strategy of stake splitting.
When a validator splits its stake into N parts, creating N new validators, the aggregate block production rate increases. This is because \( Nϕ_f(α/N) \) is greater than \( ϕ_f(α) \) due to the effect of stake splitting on the leader election function.
If f, α, and N are sufficiently large, it's possible for \( Nϕ_f(α/N) \) to be greater than 1, implying that collectively, these N validators are expected to propose more than one block per slot on average, which contradicts the properties of a probability function that must always be between 0 and 1. As a side effect, there will be slots with multiple leaders selected and eventually slots with no leader elected — empty slots.
Understanding the Correlation Between Wealth Concentration and the Leader Election Function
We created an agent-based model to better understand whether wealth concentration was an emergent pattern when the above-presented leader election function drives the leader election process.
Table 1: Parameters for base case simulation
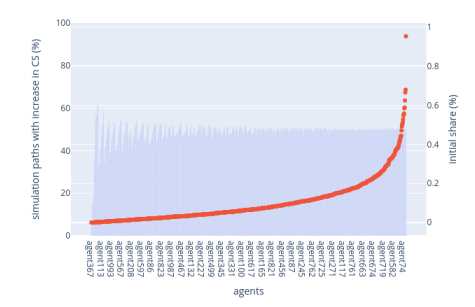
Figure 1: Base Case Simulation with Pareto distribution (shape 10) of the initial circulating supply
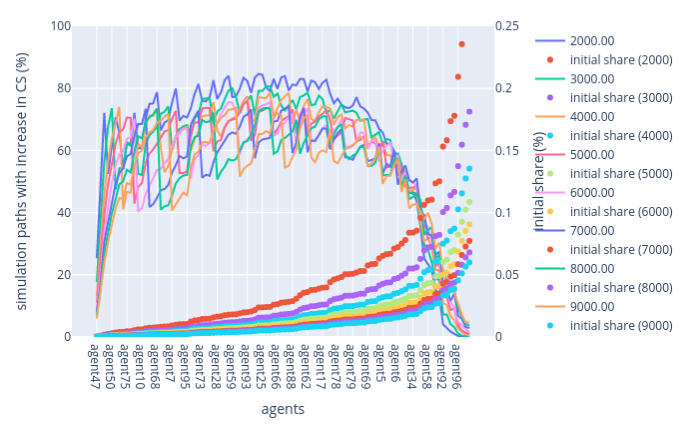
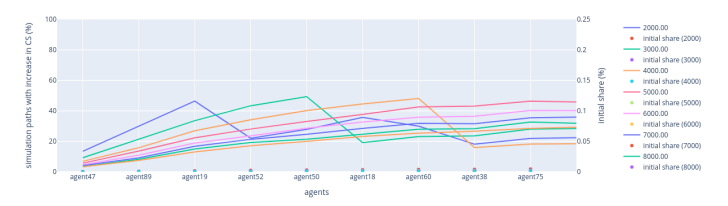
We then wanted to explore how a validator's initial portion of the total circulating supply is related to their likelihood of augmenting this share over time.
This is calculated through the occurrence of random paths in which a validator increases its share of the staked supply. First, validators are sorted based on their initial share of the circulating supply. This is shown in red curves (right-hand side axis initial share (%)). Second, out of 10000 simulation paths, we count the number of paths that led to an increase in circulation supply by a given agent. This is shown in blue bars (left-hand side axis).
In Figure 2, we present the scenario where the next block leader extends the block produced by the previously elected leader with the lowest VRF (Verifiable Random Function) output.
Figure 2: Lowest VRF output rule
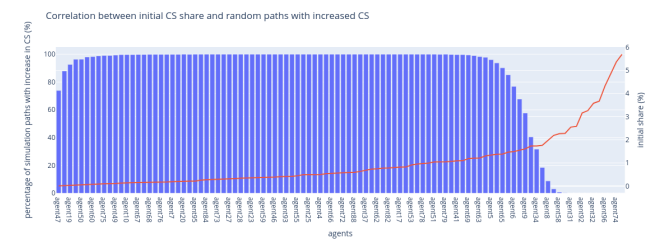
This rule tends to reward lower-stake validators when they are chosen as block proposers because their VRF outputs are statistically likely to be lower than those of higher-stake validators.
Figure 3 illustrates the situation where the next block leader extends the block produced by the previously elected leader with the highest VRF output.
Figure 3: Highest VRF output
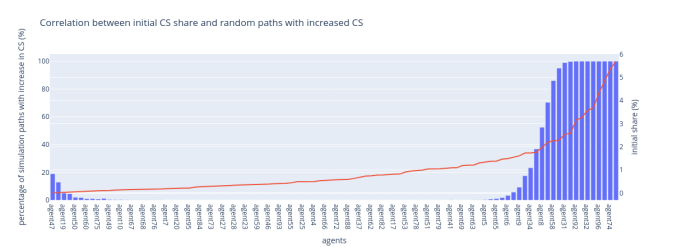
Contrary to the lowest VRF output rule, this one favours high-stake validators because their higher VRF outputs increase their chances of being chosen as the block proposer.
These two figures show that the initial stake share is a significant determinant of the potential for stake growth. However, the two fork-choice rules create different dynamics and potential outcomes for validators.
Sensitivity Analysis: Active Slot Coefficient
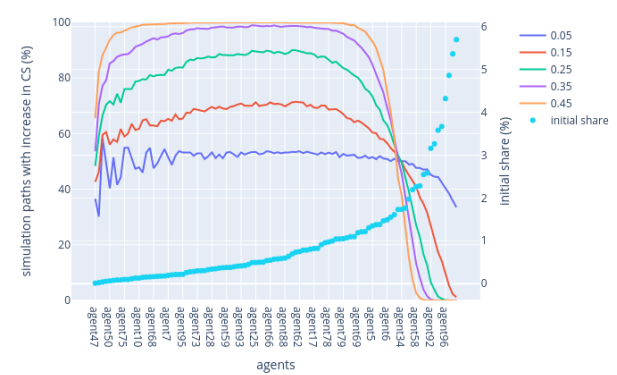
Following the base case parameters, we examine the effects of varying the active slot coefficient on the probability that validators will increase their share of the total staked tokens over time.
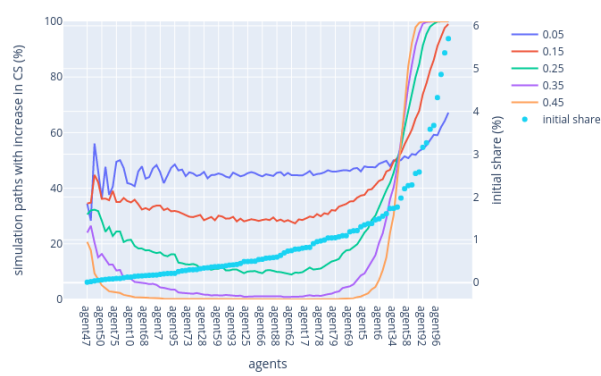
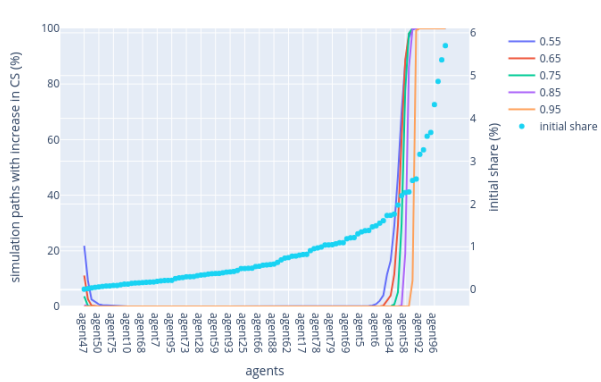
We explore different scenarios by adjusting the coefficient from 0.05 to 0.95 in increments of 0.1. For clearer visualization, the results are split into lower (0.05 to 0.5) and higher ranges (0.5 to 0.95).
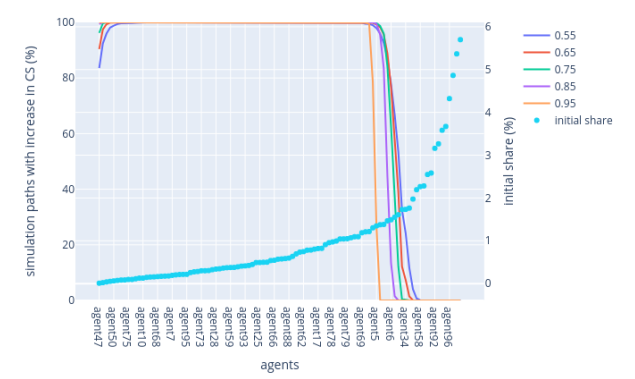
For the lowest VRF rule, the simulation shows that, at lower active slot coefficients, there's a guaranteed increase in circulating supply share (CS) for mid-stakeholders (validators holding neither too low nor too high a share of the initial CS). As the coefficient approaches 0.5, the percentage of paths leading to an increased CS converges to 100%. However, this percentage sharply decreases for validators initially holding more than 1.5% of the CS, highlighting the influence of the fork-choice rule on wealth distribution. This can be observed in Figure 4.
Figure 4: Lowest VRF rule — Lower range & higher range
In contrast, the highest VRF rule simulation indicates that as the active slot coefficient increases, high-stakers tend to consolidate their hold on the staked supply. This suggests that the choice of fork-choice rule, combined with the active slot coefficient, significantly affects the distribution of wealth and power within the PoS system, potentially leading to different degrees of centralisation or decentralisation over time. This can be observed in Figure 5.
Figure 5: Highest VRF rule — Lower range & higher range
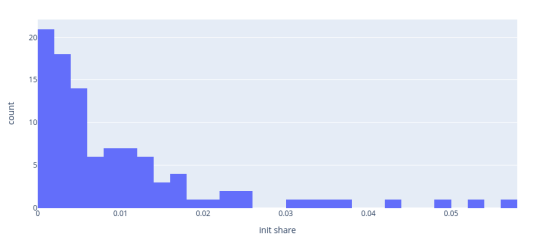
Sensitivity Analysis: Probability Distribution of the Initial Share
This section explores how the initial distribution of staked tokens among validators affects the outcomes regarding wealth concentration. We follow the base case parameters but alter the number of validators to 1000 and the shape parameter of the Pareto distribution, which is used to model the initial distribution of stakes among validators. The shape parameter essentially controls the inequality of the distribution: lower values indicate more inequality where a few large holders possess most of the wealth, while higher values suggest a more equitable distribution of tokens.
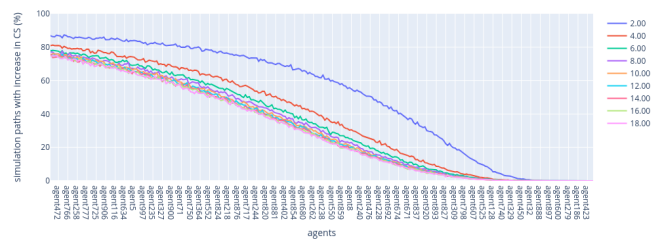
For each fork-choice rule, the initial CS share follows the Pareto distribution, with shapes from 2 to 18 and increments of 1.
In the Lowest VRF rule, we divide the results into low-stakers and high-stakers regions to indicate how the probability changes for validators at different ends of the wealth spectrum.
Figure 6: Sensitivity Analysis: Probability Distribution of the Initial Share
Lowest VRF rule — low-stakers region: The results for the low-stakers region show that the chance for low-stakers to increase their stake is not uniform and can show some unexpected behaviour (spurious oscillations), which was not observed with fewer validators (such as 100). This suggests that outcomes can be quite variable for validators with smaller stakes, as shown in Figure 7.
Lowest VRF rule — high-stakers region: For the high-stakers, the simulation indicates that as the shape parameter of the initial Pareto distribution increases (becoming less concentrated and more equitable), these validators have a higher chance of increasing their stake share. This is consistent with earlier statements that a higher shape parameter (meaning a more equal initial distribution) allows for a higher probability of stake increase among high-stakers.
Figure 7: Lowest VRF rule — Low-stakers & High-stakers
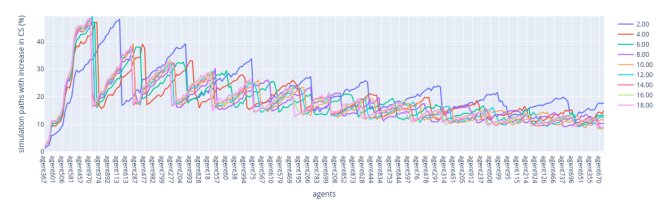
For the Highest VRF rule, the results are divided into low-stakers and high-stakers regions as well. In the low-stakers region, the spurious oscillations remain present.
On the other hand, the results for the high-stakers region indicate that higher shape values, corresponding to a more equitable initial distribution, result in a higher chance for the stakers to increase their stake. It suggests that when the wealth is initially more evenly distributed, the high-stake validators are more likely to increase their share of the total stakes. This is consistent with the observation that the higher the shape of the Pareto distribution, the less concentrated the distribution.
Figure 8: Highest VRF rule — Low-stakers & High-stakers
Sensitivity Analysis: Number of Validators
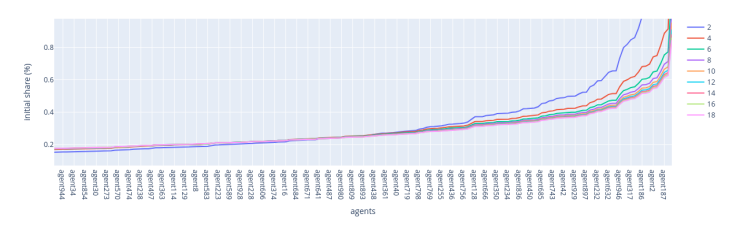
In this section, we analyse how the number of validators affects the probability of each validator increasing their share of the total circulating supply (CS) of tokens. We follow the base case parameters but alter the number of random paths to 20,000 while the number of validators varies from 1000 to 9000.
As the number of validators increases and the initial supply is kept fixed, the initial distribution of circulation supply among validators decreases. This can be observed by the sequence of dotted plots on graphs. We divide our results by fork-choice rule, and for each, the results are further divided into three parts: low-stakers, mis-stakers, and high-stakers regions.
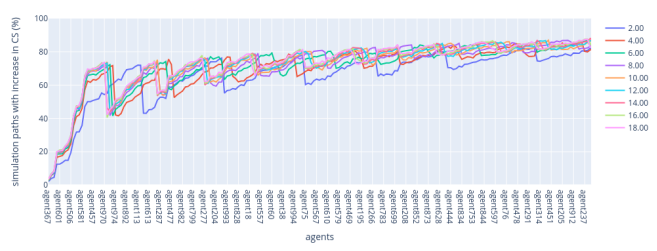
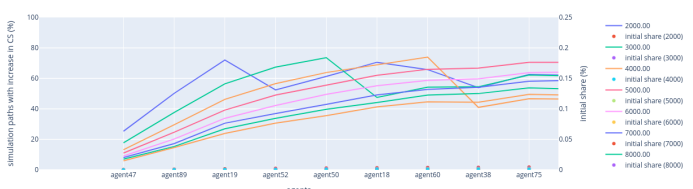
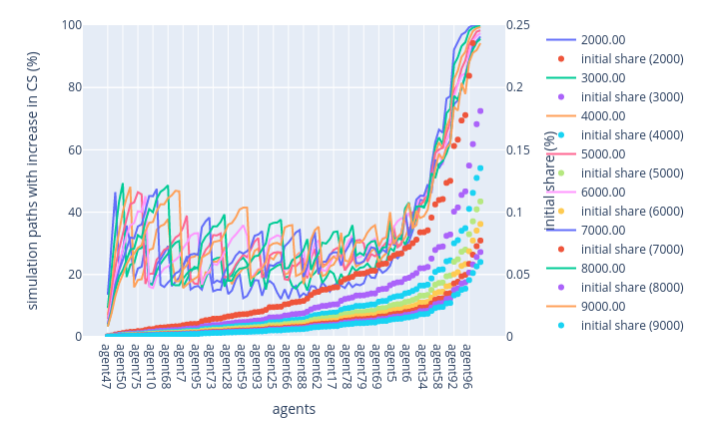
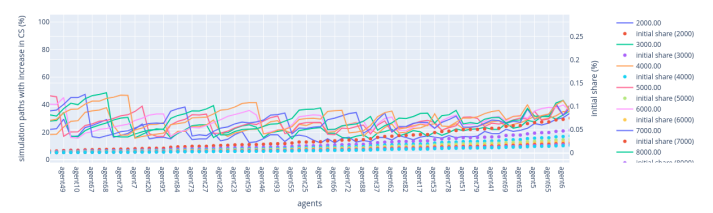
Figure 9: Sensitivity Analysis — Number of validators: Lowest VRF rule
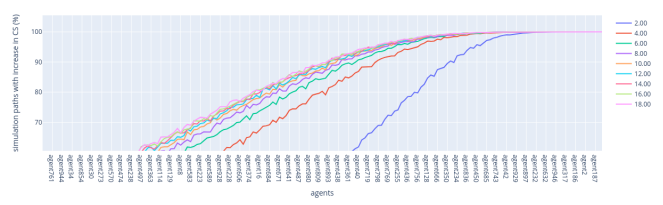
Lowest VRF rule — Low-stakers region: As the number of validators increases, the percentage of simulation paths leading to an increased CS decreases and shows less fluctuation. The shape of the initial distribution causes the inflexion point around agent75 on the x-axis. A higher shape drives this inflexion point to the left as the shape achieves a certain value.
Lowest VRF rule — Mid-stakers region: With an increasing number of validators, the probability of mid-stakers increasing their CS shows more oscillation, indicating greater uncertainty in outcomes. This means that the higher the number of validators, the more uncertainty they have with respect to an increase in their shares of the CS. This might result from the probabilistic nature of the leader election process, which randomly selects one validator, even when other validators hold the same level of stake. The inflexion point around agent6 in the x-axis is also caused by the shape of the initial distribution. A lower shape drives this inflexion point to the right, while a higher shape concentrates the inflexion point.
Lowest VRF rule — High-stakers region: For validators with a large stake, an increase in the number of validators slightly raises the percentage of paths with an increase in CS. However, there is no distinct trend in the oscillation patterns observed in the low- and mid-stakers regions.
Figure 10: Lowest VRF rule — Low-stakers, mid-stakers, and high-stakers region
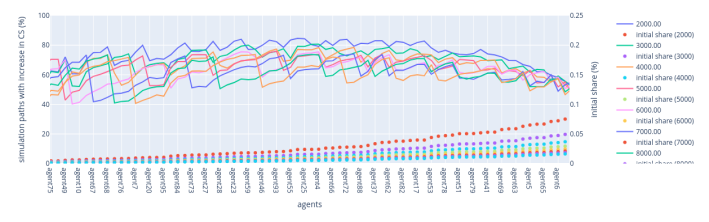
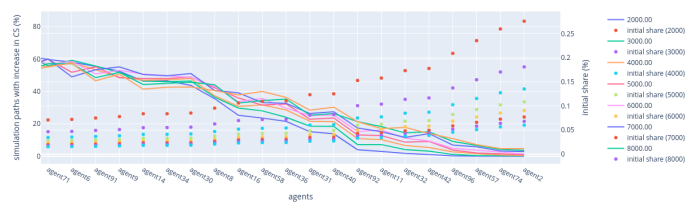
We now analyze the global behaviour of the highest VRF fork-choice rule when the number of validators increases.
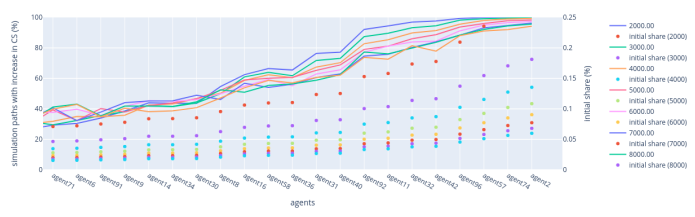
Figure 11: Sensitivity Analysis — Number of validators: Highest VRF rule
Highest VRF rule — Low-stakers region: As the number of low-stakers increases, the likelihood of validators increasing their CS decreases and the oscillations become less pronounced. The reduction in the percentage of increased CS from 70% to 40% under the Highest VRF rule, compared to the Lowest VRF rule, suggests that the high-stakers are more favoured in the Highest VRF scenario, leading to lower chances for low-stakers to improve their position.
Highest VRF rule — Mid-stakers region: For validators in the middle range of the stake size, the simulations show an oscillation pattern similar to that under the Lowest VRF rule. As the number of validators increases, the uncertainty regarding CS increases for mid-stakers, indicating a more competitive environment where outcomes become less predictable.
Highest VRF rule — High-stakers region: For those with large stakes, an increase in the number of validators results in a general decrease in the percentage of paths leading to an increase in their CS. This decrease is attributed to heightened competition among high-stakers. More validators with significant stakes compete for the same block rewards, making it harder for anyone to consistently increase their stake share.
Figure 12: Highest VRF rule — Low-stakers, mid-stakers, and high-stakers region
Stochastic Fork Choice Rule
In this part of the analysis, we now focus on another rule: the stochastic fork-choice rule. Instead of favouring validators with either the lowest or highest VRF outputs, the stochastic rule selects block producers randomly, giving each validator an equal chance to be chosen, regardless of their stake size.
This method can be more equitable in the sense that it doesn't systematically advantage validators with larger or smaller stakes as the lowest or highest VRF rules might. Each validator, regardless of their stake, has a 50% chance on average to increase their relative stake over time, except for spurious fluctuations noted in the lower-stake regions, when the active slot coefficient equals 0.5.
Figure 13 illustrates the outcome of simulations under this rule.
Figure 13: Stochastic Fork Choice Rule